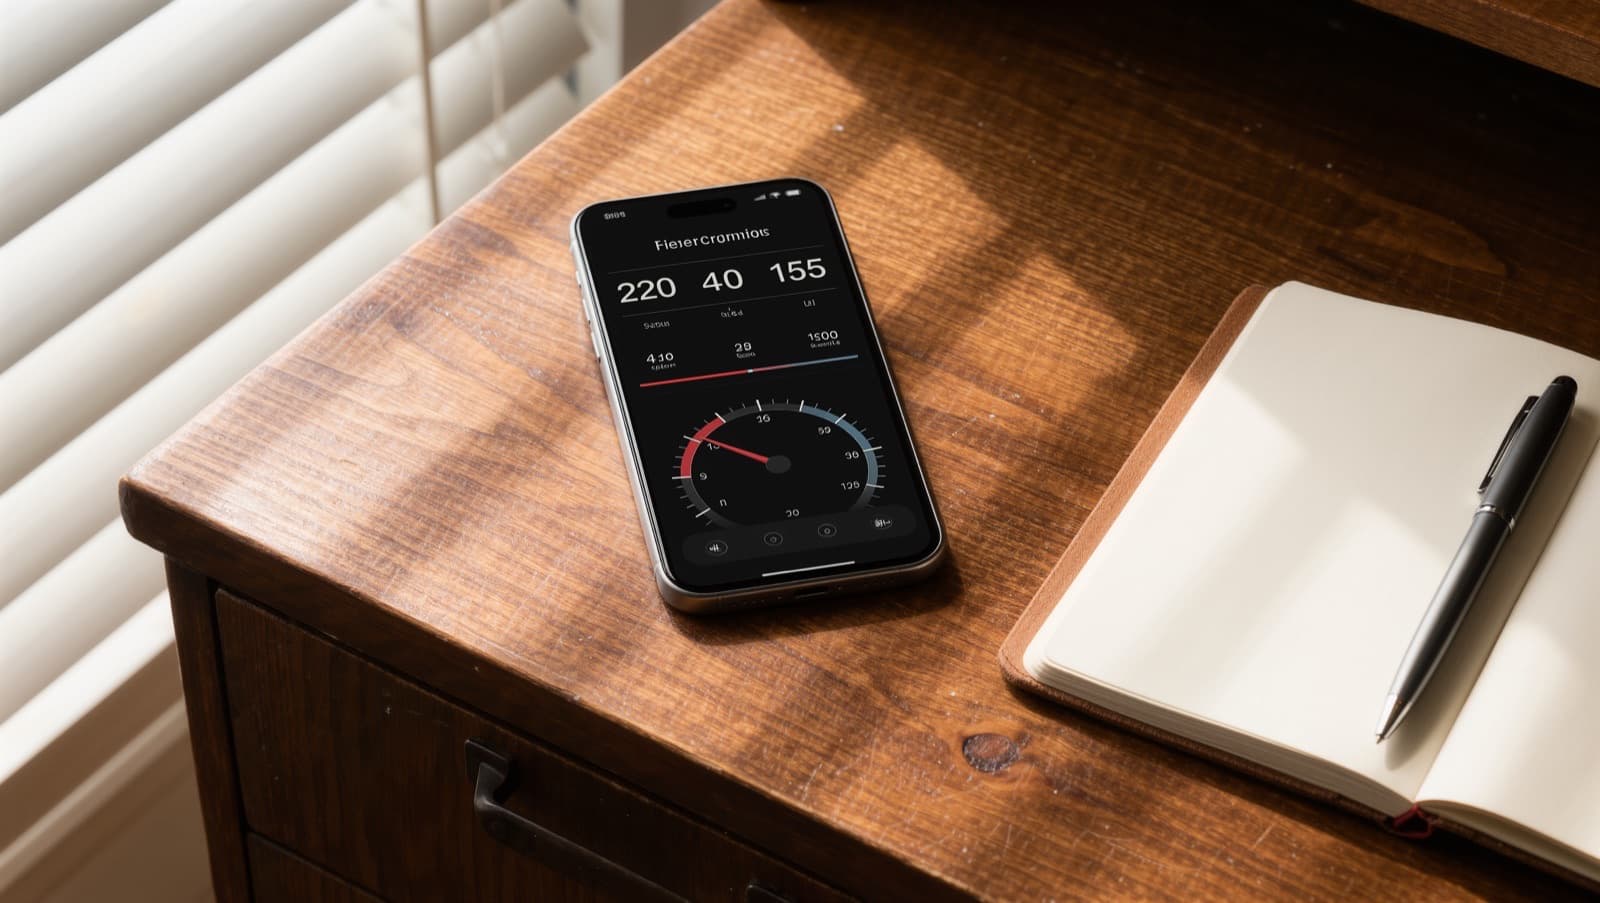
Why the Phone Version Is the One That Counts
Google reads the mobile version of your website first. In 2023 Google completed its move to mobile-first indexing for all websites, which means the version a person opens on a phone is the one Google uses when it evaluates the site. The desktop version is still there, but it is not what Google measures for speed.
The score Google gives a page runs from 0 to 100. Under 50 is labelled poor and marked in red by Google's own PageSpeed Insights tool. Between 50 and 89 is labelled needs improvement. Ninety and above is good. Anyone can run this test by typing a URL into the tool.
Most business owners have never looked at this number. When they do, the result is often lower than they expect.
What the Scores Showed on Twelve Sites We Checked
In September 2026 we ran the PageSpeed test on twelve roofing company homepages on Oahu, found through a Google Maps search for roofing contractors in Honolulu. Same phone test on every site. Here is how the scores fell across Google's three bands:
| Score band | Count |
|---|---|
| Under 50: poor | 6 of 12 |
| 50 to 89: needs improvement | 6 of 12 |
| 90 or above: good | 0 of 12 |
Six of the twelve scored under 50. The median was 51. The highest score was 78. None reached the good range.
Here is the detail most owners miss: the same PageSpeed tool runs a separate SEO check alongside the speed test. Three of the twelve sites scored a perfect 100 on that check. All three still had slow phone speed scores. That check looks at whether titles, descriptions, and links are in order. It does not measure how fast the page loads. A site can score 100 on the SEO check and score in the 30s on speed. On some of these sites, that is exactly what happened.
For businesses in Hawaii that draw customers from out of state, a slow site costs more than average. A person planning a fishing trip or comparing contractors before arriving on the island is searching on a phone, often on a cellular connection slower than a laptop on wi-fi. A slow page may be the only chance to make an impression, and that chance lasts about three seconds.
What a Slow Score Costs
A score under 50 costs the business in two ways.
The first is with visitors. Google's research found that as a mobile page's load time rises from one second to five seconds, the probability of the visitor leaving before the page finishes loading goes up by 90 percent. A person on a phone who hits a slow site often closes it and opens the next result. The page never had a chance to do its job.
The second is with how Google assesses the site. In 2021 Google formalized its speed signal into Core Web Vitals, a set of measurements covering loading speed, response to a tap, and layout stability. Google uses data from real Chrome users to judge whether a site passes. Sites that pass have an advantage over sites in the same category that do not.
The two costs reinforce each other. A slow page drives visitors away. Google reads those departures as a signal the page was not useful, and that factors into where the site appears when the next person searches.
What Makes a Site Slow on a Phone
Most poor phone scores trace back to the same three causes.
Images not sized for the web. A photo taken on a phone or downloaded from a stock site is often three to five megabytes. Resizing and compressing that image to under 200 kilobytes cuts load time significantly. This is the most common cause of a low score and the single largest fix available on most sites.
Code that blocks the page from loading. Themes and plugins load JavaScript files and stylesheets before the page can display anything. A visitor on a slow mobile connection sees a blank or frozen screen while those files download. Moving non-essential code to load after the visible content appears can shift the score by ten to twenty points on its own.
A slow server response. Older shared hosting plans can add several hundred milliseconds before the first byte of the page leaves the server. Everything else waits behind that. This shows up less often than image bloat but is common on sites that have not moved to faster hosting in several years.
Older WordPress and Wix sites tend to carry all three. Plugins added over the years, themes updated piecemeal, and images uploaded straight from a camera add up. A site that loaded quickly in 2018 may score in the 30s today without any deliberate change, because what counts as adequate performance has risen and the site has not moved with it.
The Score Is a Starting Point, Not the Full Picture
A score under 50 matters. So does knowing which of the three causes is driving it.
The PageSpeed test returns a breakdown of what is dragging the score down, sized by impact. The biggest items on that list are where a fix produces the most movement. Compressing images and deferring unused code often address the top two or three items, and those two changes alone regularly move a score from poor into the needs-improvement range.
Speed is one of several things Google reads about a page. A site with a score of 45 but a clear title, one main heading, and correct business markup is in a different position than a site with every problem at once. The homepage check shows those other signals alongside speed, including whether titles run long, whether images have descriptions, and whether Google can identify what kind of business the site belongs to.
Check your score now at /tools/speed-check. If the score is under 50, or if you want to see everything the site has wrong at once, the free audit at /audit covers every page, the Google listing, reviews, speed on mobile and desktop, and how competitors compare, returned as a list of what to address first, yours to keep either way.